Sea Level Rise Data
Explore this section to deepen your knowledge of this issue and how it impacts contaminated sites along Richmond’s shoreline and the San Francisco Bay.
Zeneca Site Specific
-

Sea Level Rise Assessment (2023)
Dr. Kristina HIll
-

Sea Level Rise Assessment (2022)
Dr. Kevin Befus
-
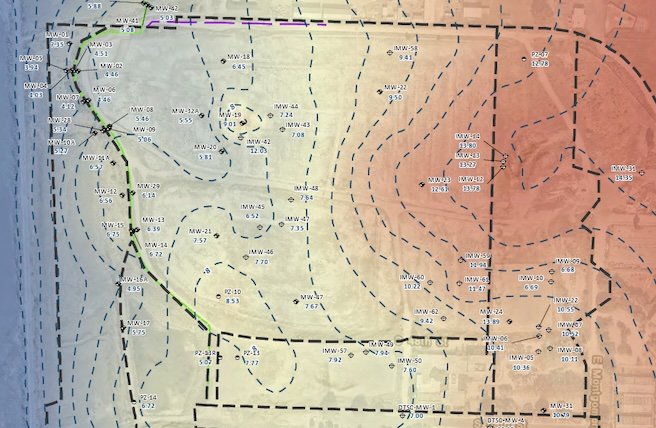
Campus Bay (aka Zeneca site) Sea Level Rise Assessment (2022)
Terraphase Engineering (for Zeneca, Inc.)
San Francisco Bay & California
-

Sea Level, Sewers and Public Health
University of California, San Francisco (UCSF) EaRTH Center
-

State Agency Sea-Level Rise Action Plan (2024)
California Ocean Protection Council
-

DTSC Sea Level Rise Guidance (2023)
California Department of Toxic Substances Control
-

Shallow Groundwater Response to Sea-Level Rise (2023)
Climate Pathways, SF Estuary Institute, University of California, Berkeley
-

Rising Coastal Groundwater as a Result of Sea-Level Rise (2023)
K. Hill, D. Hirschfield, C. Stanhope Lindquist, F. Cook, S. Warner
-

Groundwater and Sea Level Rise What's At Risk? (2022)
Video Presentation by Dr. Kristina Hill
-
Making Californai’s Coast Resilient to Sea-Level Rise (2020)
California Ocean Protection Council
-
Sea Level Rise
California Department of Toxic Substances Control
-

California Against the Sea
Video with Rosanna Xia and California Natural Resources Agency
Interactive Maps & Tools
-

Bay Adapt Currents Dashboard
San Francisco Bay Conservation and Development Commission
-

Adapting to Rising Tides
San Francisco Bay Conservation and Development Commission
-

Hazard Map
Point Blue Conservation Science and US Geological Survey
-
Sea-Level Rise Risk and Shallow Groundwater: Future Conditions Map
San Francisco Estuary Institute
-

Sea Level Rise Viewer Tool
National Oceanic and Atmospheric Administration
-

5,000+ SF Bay Toxic Sites Under Threat of Rising Groundwater
KQED
General Information
-

Sea Level Rise 101
Richmond Shoreline Alliance
-

Groundwater Rise 101
Richmond Shoreline Alliance
-

Antarctic Sea Ice Melts to Unprecedented Levels (2023)
Hydro International
-
![Person standing in the middle of a flooded city street.]](https://images.squarespace-cdn.com/content/v1/67466b8557daa354675fcda0/53fb6ab8-e8d2-40d6-b737-078a11908b8a/US+Sea+Level+Changes+Technciual+Report+%282022%29+Image+2.jpg)
U.S. Sea Level Changes Technical Report (2022)
Coordinated Effort of U.S. Federal Agencies
-

Consideration of Climate Resilience in Superfund Cleanup Process (2021)
U.S. Environmental Protection Agency
-

Sea Level Rise
Woods Hole Oceanographic Institute
-

Climate Models Are Getting It Wrong. What's Going On?
Just Have a Think